

A Financially Material Measure for Managing Transition Risks
This research piece was co-authored by Rachel Teo, Head of Sustainability and Total Portfolio Sustainable Investing; Wong De Rui, Vice President, Sustainability Office and Total Portfolio Sustainable Investing; and Lloyd Lee, Vice President, Investment Insights Group at GIC.
Executive summary
- Climate-related transition risks are rising with increasing government commitments to fight climate change, as well as technological progress in green solutions. Carbon taxes are a key policy lever for governments to curb emissions and fight climate change. Hence, investors will need robust metrics and tools to assess the impact of carbon taxes, a critical transition risk factor, on companies’ earnings and investors’ portfolio returns.
- Unlike other carbon metrics, such as carbon footprint and weighted average carbon intensity (WACI), carbon earnings-at-risk (CE) offers a more financially material and forward-looking risk measure for carbon pricing that can also be incorporated directly into companies’ valuation analyses. This enables investors to estimate the portfolio’s value at risk due to carbon prices.
- The future trajectory of carbon prices is uncertain. We recommend employing CESA (Carbon Earnings-at-risk Scenario Analysis), which combines CE with a scenario analysis approach for assessing CE at the total portfolio level and identifying specific areas of vulnerabilities within the portfolio for deeper due diligence.
- Our analysis finds that the carbon price impact varies widely across climate scenarios, ranging from 0% to 14% for a global equities portfolio tracking the MSCI All Country World Index. In a Failed Transition scenario where policymakers do nothing and carbon prices regress, companies face lower carbon costs and higher profits from today’s carbon price levels. On the other hand, in a Net Zero scenario, where policymakers implement ambitious climate policies, including higher carbon prices, to contain global warming to 1.5ºC, companies will incur higher carbon costs if they do not adopt more sustainable business practices.
- Carbon prices can have a material and long-lasting adverse impact on companies’ profitability and investment returns. Investors need to identify the industries and companies driving these downside risks in the portfolio, engage with companies to understand their strategies for mitigating these risks, and assess their credibility for delivering on these mitigating strategies.
The importance of understanding carbon earnings-at-risk
Climate change is the crisis of our generation. The latest report by the United Nations Intergovernmental Panel on Climate Change (IPCC) indicated that the probability of containing global warming to 1.5ºC by the end of 2100 is low. Governments around the world must urgently deploy all possible policies at their disposal to curb emissions and avert a climate catastrophe.
A key policy lever for governments to address climate change is a carbon price which penalises high emitters and incentivises investments in clean technologies. Momentum in the adoption of stringent carbon prices has gathered pace. The scope of carbon pricing regimes has almost tripled over the last decade from 8% to 23% of global greenhouse gas (GHG) emissions (Exhibit 1). Over the past 12 months, the global average carbon price has doubled from US$3/tonne in 2021 to US$6/tonne in 2022, but international climate experts estimate that this will need to reach US$76-$234/tonne by 2030 to contain global warming to 1.5ºC by the end of the century (Exhibit 2).
The timing of carbon price increases is uncertain, but current prices are unsustainably low and the direction of travel for carbon prices is firmly upwards. It is not a question of if, but when and by how much, carbon prices would rise in the medium to long term. Investors should therefore understand the potential impact of an increase in carbon prices on their portfolios across a range of different climate scenarios.
Exhibit 1: GHG emissions covered by carbon pricing regimes have expanded substantially between 1990-2022

Source: World Bank
Exhibit 2: Carbon prices required by 2030 to achieve net-zero emissions by 2050

Note 1: The IEA net-zero carbon prices by 2030 are provided for advanced economies, select emerging market (EM) economies (China, Brazil, South Africa and Russia), and other EM economies. The IEA does not provide a world aggregate price, nor emissions data by country. The figure shown is the emissions-weighted average of the required carbon price based on 2019 country emissions data by the World Resources Institute.
Note 2: Reuters conducted a poll amongst 30 climate economists on the required carbon price in 2021 to arrive at net-zero emissions by 2050. The figure shown here is the median estimate of the poll. We assume that these economists would minimally estimate that price for 2030 as well.
Note 3: The NGFS carbon price by 2030 is the average of three climate models (GCAM, Remind-Magpie and Message-Globiom) for the “Net Zero by 2050” scenario released on 9 September 2022. The carbon prices in the Net Zero by 2050 scenarios given by these three models range from US$129/ton CO2e to US$431/ton CO2e in 2021 US dollars.
Source: Reuters, IMF, NGFS, IEA, WRI, GIC calculations
A more robust carbon pricing risk measure
The Task Force on Climate-Related Financial Disclosures (TCFD) has helped to advance carbon measures by proposing thoughtful standards, such as a portfolio’s weighted average carbon intensity (WACI). As industry knowledge and understanding evolve, there are always opportunities to build on that solid foundation. We believe that our Carbon Earnings-at-risk Scenario Analysis (CESA) metric offers an improvement over existing carbon pricing risk measures in three dimensions: (1) materiality; (2) future orientation; and (3) ease of integration into financial analysis.
Materiality: Carbon pricing risks to a portfolio may not be as significant as a high WACI would suggest if the investee companies have high profit margins or are operating in markets with less drastic changes in carbon prices. CESA translates carbon intensity into an estimated impact on companies’ earnings and incorporates the aforementioned factors to create a more financially material risk measure.
Future orientation: WACI is typically computed based on the estimated or most recently disclosed carbon intensity metrics of companies and is backward-looking. We incorporate future-oriented elements in our CESA measure, such as companies’ emission commitments, their long-term profit margin profile and a range of future possible carbon prices based on internationally recognised climate scenarios developed by the NGFS or the IEA. These elements will enable us to develop a more forward-looking measure of carbon pricing risk. Further details on these future-oriented elements can be found in “Box 1: Carbon Earnings-at-risk Scenario Analysis (CESA) in practice”.
Ease of integration: Unlike WACI, which is a non-traditional financial metric, the CESA measure expresses carbon pricing risks in terms that investors are familiar with, which is the impact of an increase in a risk factor (in this case, carbon prices) on a company’s profits. This approach is more relatable for investors and makes it easier to integrate carbon pricing considerations into existing investment processes.
Box 1: Carbon Earnings-at-risk Scenario Analysis (CESA) in practice
The schematic diagram in Exhibit 3 outlines the steps for conducting CESA on a company’s earnings.
Exhibit 3: Overview of the CESA methodology
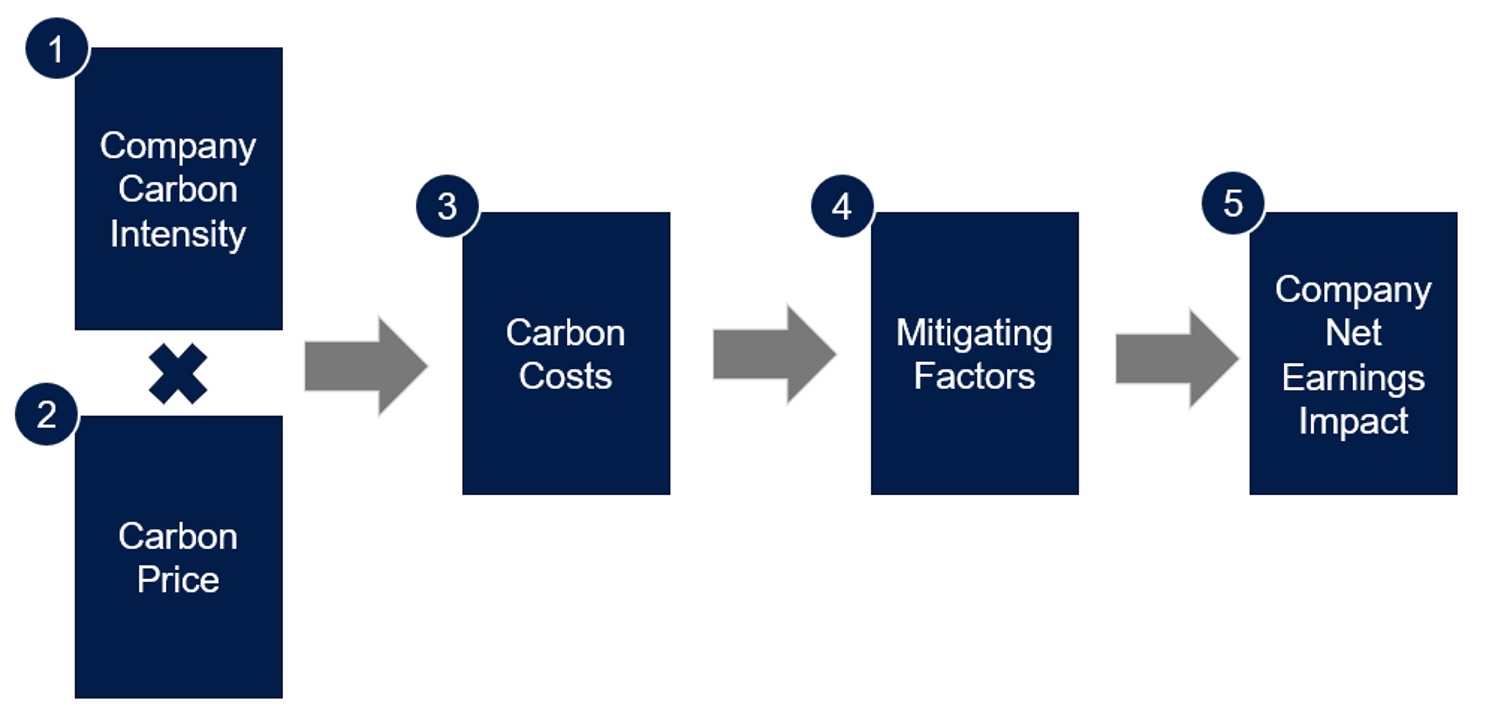
Step 1 (Carbon intensity): We estimate a more forward-looking view of the company’s carbon intensity profile based on its historical track record and emission targets for the future. Weights attached to either vary depending on the company’s historical emission trend in relation to the emission trajectory required to achieve its emission commitments. For example, if the company was reducing its emission intensity at a rate that is slower than what is required to achieve its emission goals, our model would err on the side of caution and place more weight on its historical track record rather than assume that the company would meet its emission targets.
Step 2 (Carbon prices): Many carbon pricing risk models in the market assume the same universal carbon price change in their approach. While this assumption benefits from simplicity, it can lead to carbon pricing risk estimates that do not reflect operating realities. Moreover, future carbon prices are uncertain, and it is more prudent to investigate a range of plausible carbon price outcomes than to bet on a single point estimate. To address these gaps, we recommend accounting for varying carbon price levels across different scenarios, regions, and industries that a company is potentially exposed to. For the purposes of this paper, we curated a range of future carbon prices from best-in-class models by the NGFS, the IEA, Ortec Finance and Planetrics to conduct CESA. Using estimates from different models helps to mitigate model risk that may arise from solely relying on one climate model.
Step 3 (Carbon costs): A company’s carbon cost liabilities are the product of its carbon intensity and the increase in carbon prices that it is exposed to, which varies across geographies and industries. We also model Scope 1 and Scope 2 carbon emissions costs separately. Scope 1 emissions are direct emissions from the company’ operations. The company would be wholly liable for the carbon costs resulting from these emissions. Scope 2 emissions are largely from the company’s use of power. The cost impact depends on whether the power utilities would engage in the pass-through of carbon costs, essentially raising the price of services to cover the increased costs of production in the regions that the company operates in.
Step 4 (Mitigating factors): The final impact of carbon costs on the company’s earnings can vary depending on its ability to pass on those costs to customers without affecting demand for its goods and services. In consultation with the GIC investment teams, CESA accounts for these mitigating factors by applying the appropriate cost pass-through assumptions to the carbon costs computed from Steps 1 through 3.
Step 5 (Company net earnings impact): A company’s profitability varies over time. To minimise distortions from short-term profit volatility, we use a “through-the-cycle” profit margin, which can be based either on the average profit margin observed over the last five years (if the company is not covered in our internal analysis) or our internal investment analyst’s views on the company’s long-term profit margin.
Numerous investment applications
CESA has three potential investment applications: (1) to measure total portfolio carbon pricing risks; (2) to identify vulnerabilities in the portfolio that would require deeper due diligence; and (3) to integrate carbon pricing risk into bottom-up investment processes for risk management and corporate engagement.
Total portfolio carbon pricing risks: CESA is scalable to cover the entire portfolio for an aggregate view of carbon pricing risks, flexible to apply carbon prices in a broad range of scenarios and can be applied to a wide range of data sources. Exhibit 4 shows the range of carbon pricing risk exposures for a global equities portfolio replicating the MSCI All Country World Index (MSCI ACWI). The carbon earnings-at-risk (CE) for listed equities ranges from 0% to 14%, depending on the scenario and the forecasting model for future carbon prices. Results are skewed to the downside, with only a mildly positive impact in a Failed Transition scenario where climate policies stagnate.
Exhibit 4: Range of carbon earnings-at-risk results for the MSCI All Country World Index across scenario types and forecasters for the year 2032

Source: MSCI, Refinitiv, S&P Trucost, GIC calculations
Identify pockets of vulnerabilities: Besides providing an aggregate portfolio view, CESA enables portfolio managers to identify sources of vulnerabilities where carbon pricing risks are highest and focus efforts on further due diligence. In a global equity universe such as the MSCI ACWI, the carbon pricing risks are most prominent in carbon-intensive sectors such as energy, materials and utilities, but the impacts on individual companies will vary depending on their carbon intensity, profit margins, and pricing power.
Bottom-up integration: CESA allows us to identify individual companies exposed to the potential of high climate change-related transition risks, and this analysis can be integrated into bottom-up investment processes. The estimates provide financially material quantitative points of reference in engaging with company management on carbon pricing risks across a range of plausible climate scenarios. This can act as a basis for management to plan and share how they will manage these risks.
A company that’s assessed as having high CE may still be investable. Other dimensions also need to be considered, such as the credibility of the company’s transition plan, the company’s competitive positioning relative to its industry peers, the deployment pace of substitutes that could displace the company’s carbon-intensive products/services, and the outlook on carbon prices in jurisdictions that the company operates in. Such assessments require regular engagement with company management and vigilant monitoring of climate policy developments to inform investment decisions.
Conclusion
GIC started measuring carbon metrics in 2018, and built a tool to conduct carbon price scenario analysis for our listed equity portfolio and individual companies. We have been continuing to refine our methodologies, focusing on how to design metrics to enable us to better assess climate change-related investment risks in the portfolio. CESA demonstrates the materiality of transition risks in the investment portfolio and helps to accelerate the integration of climate change considerations into our investment processes.
CESA was created based on years of research and empirical experience. The measure is a useful tool for estimating and articulating total portfolio carbon pricing risks, identifying pockets of vulnerabilities, and engaging with companies on how they are managing carbon cost increases in their businesses. We hope this publication provides a starting point for investors to think more concretely about transition risks in their investment portfolios, beyond just focusing on carbon intensity or footprint metrics in isolation.
Carbon pricing risk, however, is just one amongst a range of financially material climate-related investment issues including transition risks. Additional tools are required to assess other forms of transition risks, such as demand destruction; transition opportunities, such as green business prospects; physical risks, such as floods, wildfires, or droughts; and opportunities arising from physical risks, such as businesses facilitating climate adaptation, for a more holistic appraisal of an investment portfolio’s climate resilience.
We are excited to adopt and create such tools as the industry continues to develop, and we welcome opportunities to collaborate with like-minded investors keen to play a strong and positive role in facilitating and enabling the low-carbon transition.
Click on “Save as PDF” to save the PDF version of the paper.


